

Inflation: The Janus of Economics
The Labor Department recently announced that inflation, as measured by the Consumer Price Index (CPI), rose by 2.9% in July, while hourly wage growth was only 2.7%. This means that Americans’ real earnings decreased in June by 0.2%. What’s more, the inflation growth looks to be persistent, as the Wall Street Journal reports steadily rising costs of rent, clothing, transportation, and of course, gasoline. The market believes the Federal Reserve will raise interest rates twice more before 2019 in an attempt to curb inflation and stabilize the economy’s growth. However, what’s rocked the business media is the so-called “Chart of the Century”, showing the benefits of globalization and ruing what a Trumpian Trade War could do to reverse this. So, amidst all this, what are we to believe about the state of the economy and financial markets?
Let’s start with the past and look back at inflation. The “Chart of the Century”, shown below, is a succinct graph with overall inflation and a number of common expenditures shown over the range 1997 to 2017.
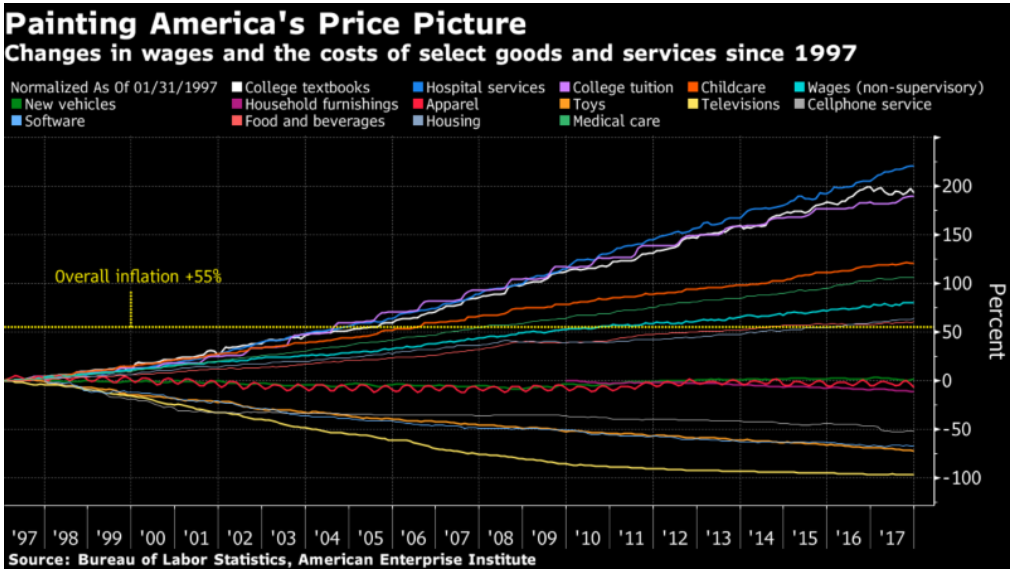
What this shows is that $1 in 1997 is equivalent to $1.55 in 2017, and costs like tuition and healthcare have risen almost 200% while durable goods like TVs and toys have decreased significantly. Most articles surrounding this use globalization as the entire cause for the decreases or the reason why cars and food haven’t risen more. While this isn’t necessarily untrue, it most likely overstates the effects that short-term tariffs can have on the global economy. Automation, rising populist sentiment, changing demographics, and increasingly “knowledge work”-driven economies are much more impactful, long-term trends than tariffs that last 2-6 years could ever be. These will be what influence rising healthcare costs, job trends, etc., and whether they (hopefully) stabilize in the medium to long term.
The financial markets are a somewhat different story. When the White House presents newly announced tariffs, through Twitter or a spokesperson, the markets react adversely. We saw the steel tariffs in March drop a broad swath of industrial and tech companies, then the April back-and-forth brought surgical strikes with only select companies falling. June has shown more volatility and market drops as the “trade war” picks up, though the broader trend still seems to be positive. Despite the tariffs, political uncertainty, and very high P/E ratios, the market continues to go up, the economy continues to expand, and unemployment remains very low. While the growing trade war hasn't halted growth in the short-term, we are seeing companies revising expectations down longer term, which means concern is growing over the geopolitical struggles.
However, there are two key metrics that will be very influential over the coming year. The first is wage growth. While unemployment keeps decreasing and is now often said to be at “full employment”, we have yet to see much in the way of real wage growth. We just saw that real earnings fell last month and had been relatively stagnant before that. Americans are quitting their jobs at rates equivalent to 2000-2001, looking for higher pay. This growing employee sentiment, combined with the rising prices we discussed earlier and the shortages of desired skills, should combine to force wages up, increasing business costs and potentially curbing stock market highs. If real wages grow, we may even see higher labor participation rates. If it does not, and real earnings continue to decline, consumer sentiment may fall, hurting discretionary spending, the economy, and of course, the stock market.
The second metric is inflation, which has sometimes been referred to with a Goldilocks metaphor. “You want not too much, not too little, not too hot, not too cold”, etcetera, etcetera. The Federal Reserve, since January 2012, has a stated “target inflation rate” of 2%, and the European Central Bank has a target of “below 2%”. Both central banks have “missed” these targets for the vast majority of the last 6 years. What’s misleading about that statement is that the Federal Reserve can’t precisely control inflation, so realistically, Janet Ellen and Jerome Powell have done well in guiding the US’s monetary policy out of the Great Recession. Now, what they’d like to do is raise the Federal Funds Rate in order to have some rate to cut when the market inevitably experiences a downturn. The market expects this rate to rise twice more before the end of the year, mostly likely adding 0.5% by 2019.
Unlike the Labor Department though, the Federal Reserve measures inflation using the Price Index for Personal Consumption Expenditures (PCE) rather than the CPI. What’s more, Congress and other government offices sometimes use the Chained CPI to measure inflation, which accounts for consumers substituting cheaper goods for more expensive goods (i.e. if the price of apples increased more quickly over time than oranges, people might substitute oranges for apples). It can get confusing, and these three measures are by no means the only three. What’s important to know in this case, is that the Chained CPI typically grows more slowly than the CPI, for better or worse, and that’s generally the reason government offices use it. For example, Social Security started using the Chained CPI under Obama in 2010, which decreased federal expenses by a projected $130 billion. That is $130 billion that the government will not have to pay to those who collect Social Security, once again, for better or worse, because the Chained CPI makes different assumptions about the future than the CPI. Eventually, we’ll see which tracked more with reality, though there is evidence to support the Chained CPI being more accurate.
So, over the next two years, we would like to see inflation, real wages, and the Federal Funds rate tick upwards in a steady and predictable manner. This should keep employees happy, markets content, and the economy growing. However, an ideal world is not the one in which we live, and as such, we will have to keep a close eye on the monthly figures to ascertain whether inflation will help the economy expand or begin its spiral into recession.
Works Cited
Bureau of Labor Statistics. “Consumer Price Index Summary.” U.S. Bureau of Labor Statistics, U.S. Bureau of Labor Statistics, 10 Aug. 2018, www.bls.gov/news.release/cpi.nr0.htm.
Bureau of Labor Statistics. “Real Earnings - July 2018.” U.S. Bureau of Labor Statistics, U.S. Bureau of Labor Statistics, 10 Aug. 2018, www.bls.gov/news.release/pdf/realer.pdf.
Franck, Thomas. “Trump's Tariffs Are Unlikely to Cause a Recession Because They Are Leaving the Most Important Part of the Economy Alone.” CNBC, CNBC, 12 July 2018, www.cnbc.com/2018/07/12/mkms-trumps-tariffs-are-unlikely-to-cause-a-recession.html.
Gibson, Kate. “Strong Labor Market Has More Americans Quitting Their Jobs.” CBS News, CBS Interactive, 5 July 2018, www.cbsnews.com/news/strong-labor-market-has-more-americans-quitting/.
Iyengar, Rishi. “US-China Trade Battle: How We Got Here.” CNNMoney, Cable News Network, 4 Apr. 2018, money.cnn.com/2018/04/04/news/economy/trump-china-us-tariffs-trade-timeline/index.html.
Levy, Gabrielle. “Book Club: The Failures of Globalism.” U.S. News & World Report, U.S. News & World Report, 27 Apr. 2018, www.usnews.com/news/the-report/articles/2018-04-27/how-automation-corruption-and-the-failure-of-globalism-let-to-brexit-trump-and-beyond.
Miller, Rich, and Vince Golle. “Chart of Century Gives Powell Gloomy Glimpse of Trade-War World.” Philippines to Shut Polluted Isle Duterte Called a Cesspool, 10 July 2018, www.msn.com/en-us/money/markets/chart-of-century-gives-powell-gloomy-glimpse-of-trade-war-world/ar-AAzPHCk?ocid=sl.
Miller, Rich. “Is the Fed's Inflation Target Kaput?” Bloomberg.com, Bloomberg, 2 Feb. 2018, www.bloomberg.com/news/articles/2018-02-02/is-the-fed-s-inflation-target-kaput.
Reuters Staff. “Factbox: ECB's Inflation Target Debate.” Reuters, Thomson Reuters, 3 May 2018, www.reuters.com/article/us-eurozone-inflation-factbox/factbox-ecbs-inflation-target-debate-idUSKBN1I40Y9.
Sullivan, Sean. “The Ins and Outs of 'Chained CPI' Explained.” The Washington Post, WP Company, 10 Apr. 2013, www.washingtonpost.com/news/the-fix/wp/2013/04/10/the-ins-and-outs-of-chained-cpi-explained/?noredirect=on&utm_term=.955b313dee13.
Watts, William. “Here's Why the Dow Took the Trump Tariffs so Hard.” MarketWatch, MarketWatch, 2 Mar. 2018, www.marketwatch.com/story/heres-why-the-stock-market-took-the-trump-tariff-announcement-so-hard-2018-03-01.


